What do UK employers want from a data scientist?
Analysing job post data from Indeed, can we make more evidence-informed career decisions?
Picture a novice data scientist, either straight out of education or pivoting careers. They are determined to enter the field but have limited time and funds to spare in extra training and are daunted by the sheer variety of skills and experiences employers request. Naturally, they sign up to intense bootcamps and scramble to take online courses on everything from Azure to Excel.
How can you be sure that focusing on a particular skill won’t prove to be a massive opportunity cost? How many years experience are they expecting? What should I expect to get paid, realistically? If you’re leafing through a data science syllabus, and you want to make sure your investment pays off then what should that syllabus include? That’s also a very pertinent question for people designing a data science course: how do we maximise the overlap between what recruiters want and what our course teaches?

About this post
I’m reporting on findings from an exploration of job data on Indeed.co.uk, so this focusses on the UK job market. Although this post provides useful answers, there are still plenty of questions to ask and it’s unclear how representative the findings are of the total population of jobs. This is why future iterations of the project in Q1 2021 and later will try to replicate / falsify the findings. If you have suggestions for other things to search for within the data or any critiques of methods used, please leave a comment. All feedback is appreciated.
If you just want the most important results, scroll to section II. Key insights.
If you want to know how those results were generated in more detail, scroll to section III. Methodology.
If you want to be able to replicate the findings, read the assumptions or see the results in full (including more of the null results), see the README in the project repo and the main notebook.
I. Why and How
Harvard Business Review dubbed Data Scientist the sexiest job of the century, and the rapid wave of data bootcamps and online courses over the past decade reflects the immense magnetism of the profession. Yet with so many people rushing into data science, it’s important to know the market and offer a competitive resume. This post and its corresponding project repository represent my initiative in adding to the trove of knowledge on the job market. This is an exploratory, single-researcher analysis, using data scraped only from Indeed, with a total sample of 1082 job descriptions and 382 annual salaries. Therefore you should take findings with a pinch of salt. The plan is to replicate the scraping and analysis during Q1 2021. I plan to broaden the range of analyses performed on the data as well as improve the quality and efficiency of the web-scraping tool. I searched for jobs with 3 different pairs of words in the title:
- data, scientist (DS)
- machine, learning (ML)
- data, analyst (DA)
I’ve included all of those under the umbrella of “data science roles” because even though it’s common knowledge that those roles do very different things and require different proficiencies, they still all do data science, and the lines between the categories is blurry.
Who does this analysis benefit? Who are potential stakeholders?
- Let’s imagine that I am an aspiring data scientist, recently starting out in the field. Regardless of my current qualifications, I want to know what employers want so I know what skills I need to go and acquire, which of my skills I can best leverage, and what I else I should learn over time to increase my potential salary.
- Let’s suppose that we are a data science course provider / bootcamp based in the UK. Our bottom line is getting our learners hired in the data science world and, additionally, trying to maximise the average salaries our graduates get. To do so, we need to match our curriculum to what the market is asking for. What’s the right combination of skills, programming languages and expertise that we should be delivering? That’s a question we can answer by looking at employer needs.
II. Key insights
1. 3 out of 5 data science roles do not state salary openly (~59%):
The discrepancy is consistent across the three categories, though wider for roles with “machine learning” (ML) in the title than those with “data analyst” (DA). This is particularly daunting for the lone, fresh data scientist entering the field, especially if they have no prior experience of negotiating pay in any field.
- If you’re an aspiring data scientist: use Glassdoor to research salaries at a company (where possible) and always bear in mind the average salary for that type of role you’re applying for. Consult any data science connections on what salaries they’ve earned over their career and compare any roles you’re interested in with similar ones that do have a salary
- If you’re designing a data science course: include salary negotiation training. Inform learners of accurate, regularly updated salary ranges in the market.
2. Analyst roles are most numerous but least well paid:
Roles with “data scientist” (DS) and ML in the title are paid on average £25k per year more. That’s approximately £13 per hour more.
Why does this matter?
If you’re aiming to maximise your salary, it’s important to know what parts of the field return greatest financial rewards over time. Having said that, consider that experience can be the greatest barrier to getting a job in data science (see Insight 4). If an analyst role is easier to get into, but you still want to aim for the higher salaried positions, then why not build on it?
Recommendations:
- If maximum salary is what you’re aiming for, then acquire skills that set you up for DS and ML roles (see Insight 3).
- Where possible use DA roles to build experience in the field — there is significant overlap between the skills required for DA and DS roles in particular (as shown in Insight 3).
- If you are more interested in analysing and reporting on data, then take comfort in the fact that there are more jobs suitable to that goal.
- For course-providers: inform learners of the full range of salaries available to them and make sure they have realistic expectations.
3. The most useful skills across all three groups, are Python and SQL:
For those just entering the field, that’s enough information to tell you where to start focusing your attention. Once you have a solid foundation in those two, here are your options:

- R programming comes up in about 47% of DS jobs, and some jobs state that although they’d accept Python, they’d prefer someone who knows R. Moreover R offers a lot of statistical analysis tools that Python doesn’t have direct equivalents to, so if you’re going for stats-heavy roles, R can give your resume an edge.
- Cloud platforms — preferably train in Amazon Web Services (AWS), but about 18% of all jobs (and 28% of ML roles) mention at least one of the 3 main cloud platforms. This is more useful if you’re heading into or training towards a DS or an ML Engineering role. The latter mention AWS ~ 25% of the time. The exception is if you’re applying for DA roles, in which case Azure is more popular than the others, but still features in only about 6% of those roles.
- If you’re going more towards the analyst route — you will likely not benefit anywhere near as much from learning Scala, Java or Docker, but you will if you’re inclined towards ML roles! The first two are popular languages for developing and optimising machine learning models, so it’s expected that ML roles would feature them. Docker is used widely for product deployment, so it would be wise to invest time in it if you’re aiming for ML.
- For bootcamps: emphasise to learners which skills get them where and make some parts of the course optional / elective: e.g. schedule an Intro to AWS lesson for all the attendants, but those who want to pursue analytics can stop attending after the intro and get more ROI taking an Advanced SQL class.
- Place less focus on deep learning: as popular as neural networks have become over the past couple of decades, they did not feature prominently, even after repeated searches through the texts for many different variations. Deep learning primarily appears in a special niche of data science roles, more towards the ML side of jobs, but is not mandatory or useful to the majority of data science roles.
4. You might need experience to get experience:
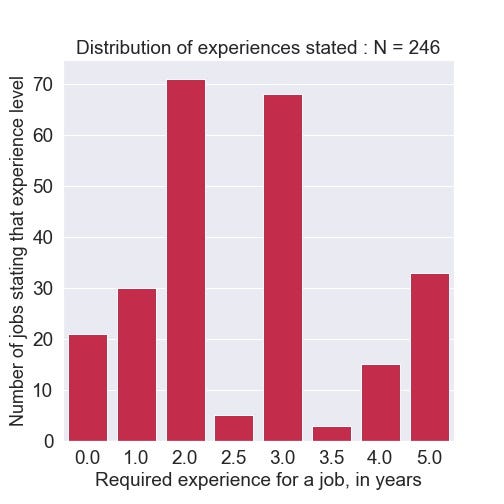
Most jobs that could be found to explicitly state an experience threshold asked for 2 to 3 years experience. If representative, this presents the largest barrier to entering a data science role. If you’re completely lacking in experience now, you might have around 20 jobs open to your level.
After 2 years working in data science, that number should be 3 times bigger. Moreover, the expected salary will increase too, as there is a moderate correlation between the two.
- If you’re just starting out in the field: building experience is crucial, so widen your expectations of the work you’ll be doing to achieve that. You may not have a dream role this year or next, but the available paths into that dream job open up significantly after only 2 years.
- Play the long game: be strategic and realistic about what job you’re applying for and make 1, 3 and 5 year plans that includes what skills you hope to have by each milestone and what salary you’d expect.
- If you’re still struggling to land a role then build experience doing freelance data science projects, data hackathons or charitable data science work.
- For course providers: make sure learners are aware of the experience barrier and also try to build connections in the job market to create mini-opportunities for grads. Employers might be skeptical of taking bootcamp grads for a position, but they might be more open to the idea of facilitating internships and single project partnerships.
5. The gap between the Capital and the rest of the country:
As you might expect, just over half of the jobs are in London. They also pay on average 50% more than in the rest of the country, which is to be expected given the much higher cost of living.
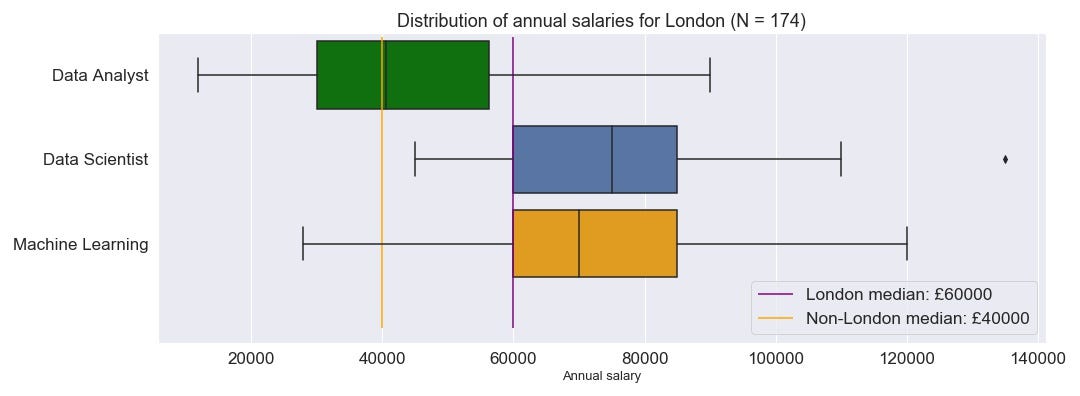
The median data analyst in London would expect to earn as much as the overall median for outside the capital.
6. There’s a split between customer- and product- centric roles, as well as a niche group of research focused jobs:
Using topic modelling (LDA) to cluster and group jobs, I could determine 3 emergent topics that weren’t just noise. These were the
- The Customer centric roles — candidates would be delivering insights towards customers and using tools such as ‘dashboards’, ‘excel’, (Power) ‘bi’ and thus providing analytical insights for the stakeholders.
- Product and development roles — candidates programming languages (‘java’), specific packages used for intensive machine learning (‘tensorflow’, ‘pytorch’) and more niche areas of data science (‘NLP’, ‘neural’ (networks)).
- Academic and Research — candidates would require higher qualifications for these roles such as PhDs. There’s a stronger emphasis on ‘publications’, ‘research’ but also on artificial intelligence and ‘novel’ techniques. These are more challenging roles to get into, but also exciting for the ML-inclined.
This last insight was generated with unsupervised techniques and it is not currently possible to verify the accuracy of those topics. However, they do corroborate other findings in Key Insight 3.
III. Methodology
For this project, I’ve followed the PPDAC cycle for data science:
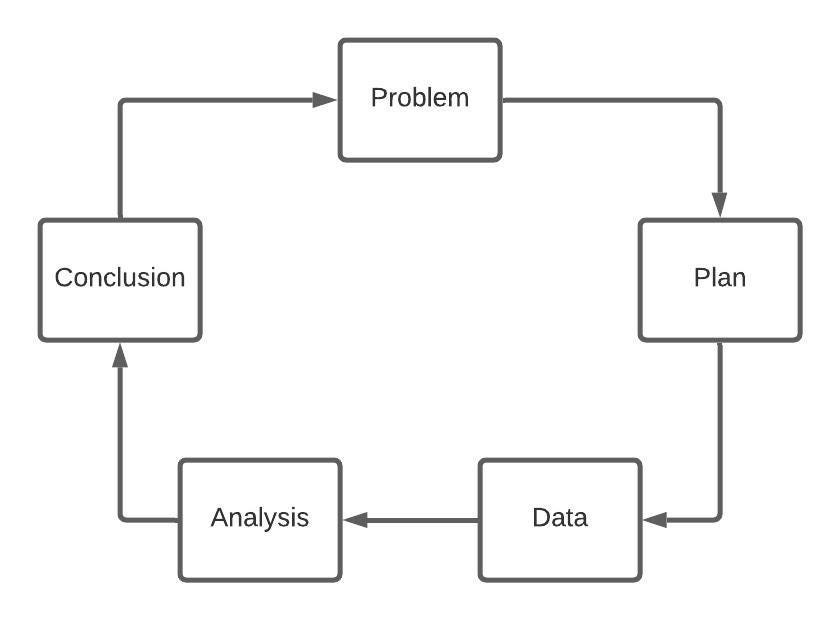
- Problem — Determine what questions we want to answer using the data.
2. Plan —What libraries would I use? How many statistical tests should I run and what confidence level should I set in advance? What
3. Data — Web-scraped job descriptions from Indeed.co.uk, searched for between 24th and 25th November, 2020.
4. Analysis — Plot salary distributions for London and non-London jobs; different job categories and jobs by which programming language they mention. With an initial alpha of 0.05 I will run several NHST tests and report on results.
5. Conclusion — Report any insights, recommendations and future steps.
1. Problem
If we want to get ahead in the data science UK job market, it would be useful to be able to answer the following:
- How many data science jobs advertise salary?
- What is the spread of salaries advertised for data scientist jobs on indeed.co.uk?
- What are the main locations that data scientist roles appear in? (London expected to be the main one)
- What are some of the most frequent words mentioned in the job title?
- Which programming languages are in greatest demand? Do any of the languages correlate with higher salary?
- Is there any relationship between years of experience required and salary?
- What are the main topics emerging from the job descriptions and the title?
2. Plan
My plan was to scrape data from Indeed.co.uk using BS4 and Selenium. Then I would extract key information such as salary, location and programming languages using regex (regular expressions). I would plot and wrangle data using the Pandas and Seaborn libraries then carry out statistical tests. I would also attempt to build a predictive model for salary using linear regression, and report on the coefficients as measures of the importance of each job feature. Lastly I would use Latent Dirichlet Allocation to look for emerging topics within job descriptions.
The ideal situation would be to answer all questions stated and to be able to state Insights and Recommendations for every part of my analysis. However, in several areas, I had to report null resorts due to either insufficient data or a lack of a signal, and will have to revisit those questions in future iterations of the project.
3. Data
From previous attempts at web-scraping jobs on Indeed.co.uk, I know that the number of jobs listed at any one time are in the hundreds, so there would likely be a problem of insufficient data for some of the questions I wanted to answer. Another problem was trying to make sure that the search terms I used captured the field of data science as much as possible, rather than just one specific role within it.
To tackle those two problems, I retrieved job data from Indeed.co.uk based on 3 separate searches. For each of these, my search results only returned job posts where the title of the job included the following pairs of words:
- data, scientist (DS)
- machine, learning (ML)
- data, analyst (DA)
There were jobs that contained a mixture of 2 of the title words (these duplicates were discarded). Moreover it’s generally known that a data analyst is doing data science, an ML engineer does do some analysis, a data scientist does use machine learning, and so on.
4. Analysis
- Most data science jobs do not directly state their salary (Fig 3.2): about 59% of data science jobs in our sample do not state salary.
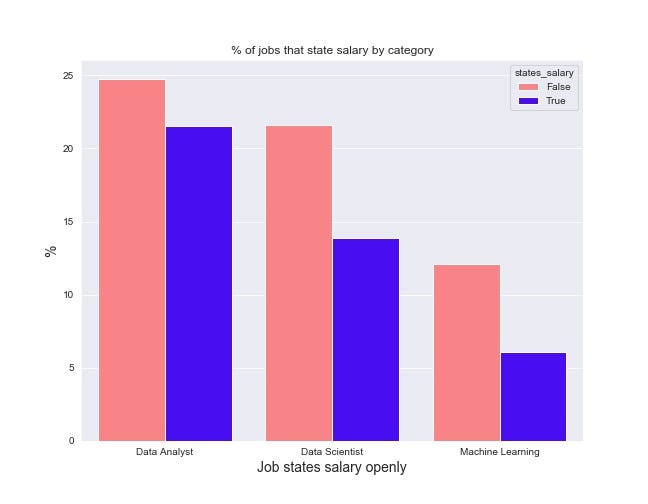
From the perspective of a recent data science grad or someone fresh out of a bootcamp, one challenge they’ll face is salary negotiation — particularly daunting when most jobs do not directly state their salary. This applies across the board to all 3 categories, although the gap is wider for DA and ML roles.
For the bootcamp’s organisers, this makes it even more important that they research salary estimates thoroughly and inform their students of this — to help reach the goal of maximising average salary of bootcamp grads they should also be given help with salary negotiation.
2. What is the spread of salaries advertised for data scientist jobs on indeed.co.uk?

Among the jobs that reported annual salary (Fig 3.3), DA jobs were not as well paid as ML or DS jobs by quite a margin — the median salaries for DS and ML are at least £12k above the median for all data science jobs; DA roles pay about £20k less!
This is fairly solid finding since it’s supported by general background knowledge about the field that analyst roles tend to be less technically specialist and pay less compared to other data science roles. If you’re aiming to maximise salary, then a recommendation might be to prepare your grads to aim for DS and ML jobs. However DA jobs are also the most numerous. They might form a reliable fallback for bootcamp grads not managing to hit targets for the DS and ML roles.
3. What are the main locations that data scientist roles appear in? (London expected to be the main one)
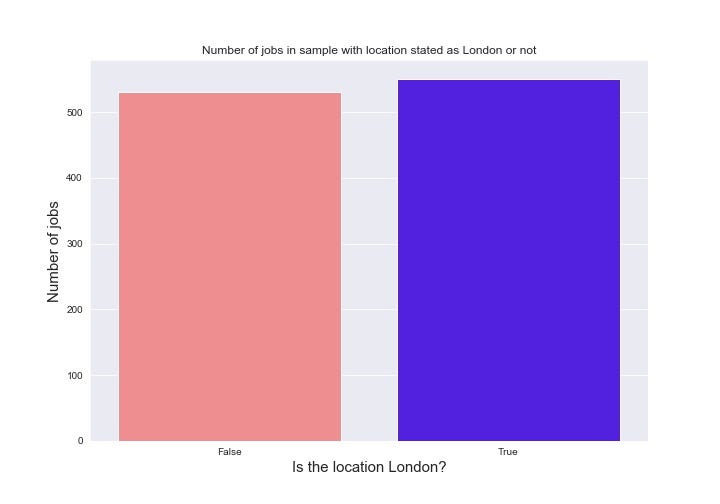
As expected, London dominates the country in terms of data science roles. Even with all the mini tech hubs, the emerging Northern cities and the Silicon Fen in Cambridge, London still edges over the entire rest of the country (Fig 3.4).
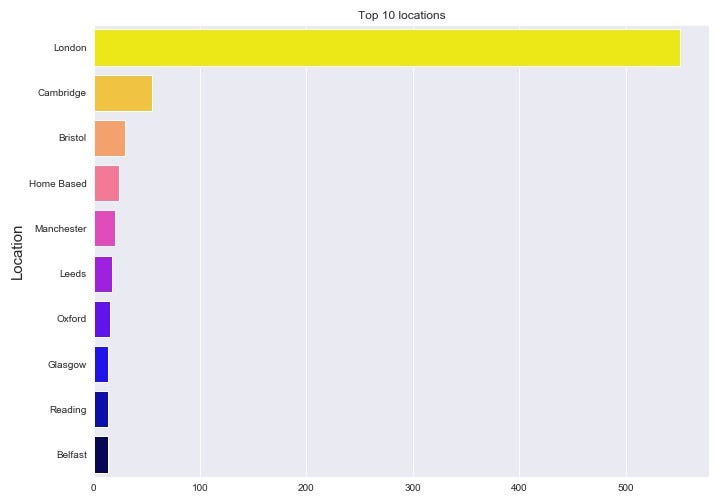
The next 9 ‘locations’ with the most data science roles are utterly dwarfed by London (Fig 3.5). The fourth most popular location (as declared in the job) is ‘Home Based’, which is unfortunate for anyone hoping data science jobs might invigorate the North or anywhere that isn’t London.
The picture becomes even more dire when we consider salary breakdown between the capital and rest of the kingdom. Figure 3.6 shows the annual salaries for the 3 sub-groups in London. The purple and yellow line show the non-London and London median salaries respectively. There is £20k difference between the two!
4. What are some of the most frequent words mentioned in the job title?
A job title can communicate a lot of things. For instance if a role mention “R” in their title (e.g. “Data Scientist with R experience”) you’ll have good reason to ignore that role if you don’t code in R. If we look at the single terms and bigrams (2 word combos) that appear most frequently (Fig 3.7) we can infer the following:
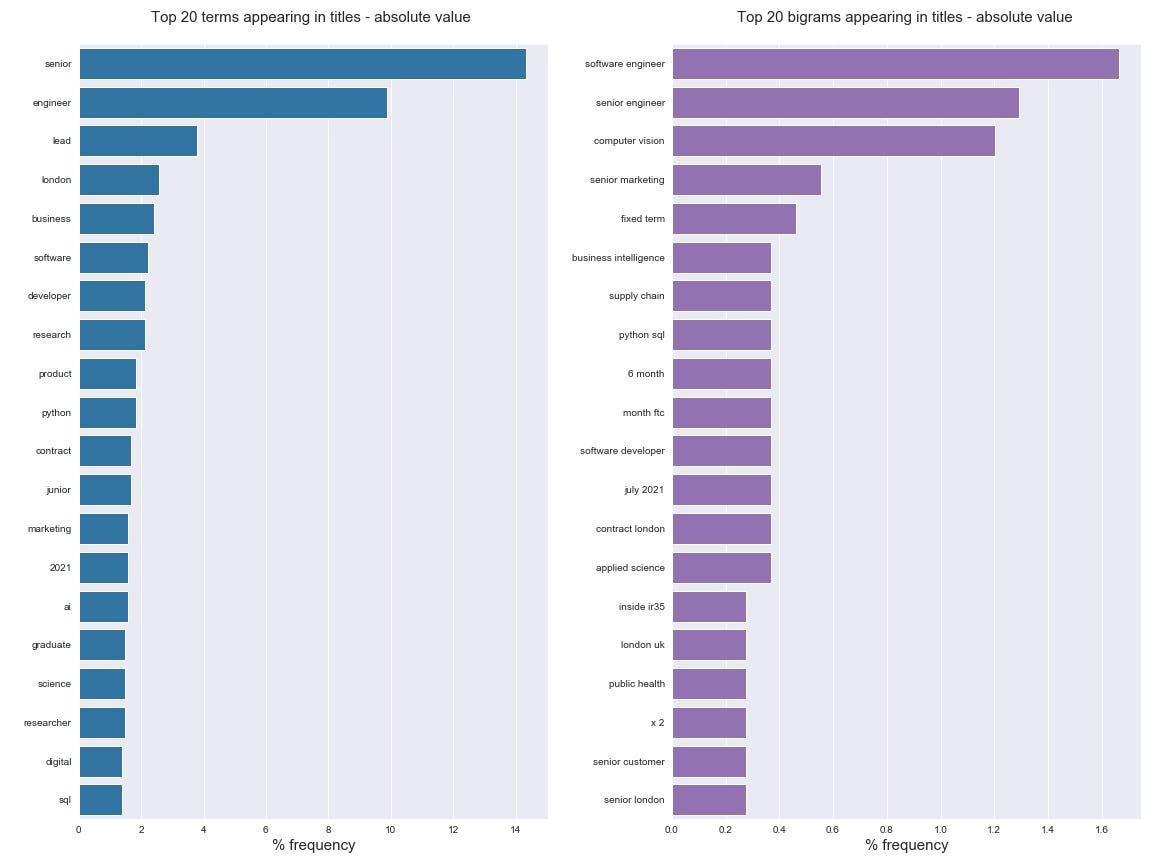
- About 14% of jobs are “senior” roles, hence looking for more experienced data scientists. This does not bode well for recent bootcamp graduates. ‘Junior’ roles make up less than 2% of the sample.
- There’s about 10% of roles that are looking for an engineer role, which could either be ‘machine learning engineer’ (most of the occurrences) or ‘software engineer’ (~19 roles in all). These are roles that would we would expect to have much stronger requirements for code development skills.
- There’s very few titles explicitly mentioning a language (e.g. Python is mentioned in less than 2% of titles. To find any trends in programming languages we’ll have to search through the job descriptions.
- Very few jobs advertise by specific area of expertise it seems (e.g. “Natural Language processing”, “public health”). The most frequent case of data science specific expertise being demanded are roles focussed on Computer Vision (13 jobs). Perhaps this would indicate that most roles look for a blend of different skills, but aren’t looking for one single specialty area. This is encouraging for us since our graduates will have some flexibility in what skills to use for leverage.
5. Which programming languages are in greatest demand? Do any of the languages correlate with higher salary?
For this question, I went beyond including just programming languages but also techniques, libraries, cloud services and skills. This has greatly increased the usefulness of the findings.
Figure 3.8 illustrates how the 10 most popular languages and skills compare across the 3 groups. This particular graph can be used to tailor your own portfolio building journey.
For instance, if you have expertise in R and SQL, you’re more well positioned to aim for a DA roles. If you have experience in Java and are considering pivoting into data science, then focusing on Python and AWS will put you in good stead.
If you’re a data bootcamp, you can help inform more clearly which skills grads can leverage towards which roles, so they can optimise their job search. Towards the end of your course, you could create ‘Data Science Profiles’ that learners can gravitate towards depending on the kind of work they would prefer doing. Those that want heavier computational work (so more on the ML side), can attend classes on Docker, Java and AWS. Those drawn more towards analytics can spend more time refining their SQL and other relevant skills.
Modelling — a null result
I next attempted to build a linear regression model for predicting salary, but it would seem that there wasn’t any way to reliably predict the salary from the features I built. After multiple iterations, dropping non-significant features and cross-validating, the summary for the best model is this:
- Model had root-mean squared error (RMSE) of about £13,000 on test data, which is a very wide margin for our purposes. So if we took a job post and predicted that the role should be paid around £40 000, on average the answer would be that figure, give or take £13k. Therefore this tool needs more / different data and features before it can be useful.
- The strongest determiner of salary was the presence of the word ‘lead’ in the title — according to the model, the difference between a role that has lead in the title and one that doesn’t is, on average, £23k.
- The weakest feature was whether the title included ‘scientist’— acc to the same model, the difference you’d expect in salary for a role that has the word ‘scientist’ in the title vs one that does not, was about £7k.
I also attempted to bin the salary data into bands so that I could attempt to predict (binned into categories such as £20'000–25'000). However, even that didn’t have much predictive power, with the best model having an accuracy of about 10% (given 10 different salary bands). To conclude, the model is nullified and I will attempt to build another in future iterations of the project, when more data is available. However, it might just be the case that the features used have no real relationship with salary.
6. Is there any relationship between years of experience required and salary?
Many new data scientists find it vexing or disappointing when they search for an “entry-level” position and find that it requires 3 years of experience in the field. But do the years of experience required stated in the job ad actually have anything to do with something more concrete, like pay?
After extracting the required experience in years from job posts using regex and averaging those that gave a range (“2–3 years experience” becomes 2.5), I compared it to salary for those jobs. Jobs with 0 years experience were found by searching for “junior role / data / position” (this is probably the most contentious assumption of the created feature). Unfortunately there were very few jobs I could extract such data for (246 job posts), although the Spearman Ranked Correlation test was significant (p value < 0.001). The experience and salary have a weak-to-moderate correlation (0.37). We must remember that this was based on data mined with regex and is relying on certain assumptions and limitations. Hence this is an important test to re-run in the next project iteration.
Out of those jobs, Figure 3.9 shows the general trend. The largest number of jobs in this group asked for 2 OR 3 years of experience. Hopefully this isn’t representative of the job market, but if it is then as a beginner data scientist, you’d have to find ways to make up for the lack of experience, e.g. by doing freelance work for a while.
7. What are the main topics emerging from the job descriptions and the title?
Using topic modelling, can we see if there are natural groups within the job descriptions? Can we split apart our data in some semantic way?
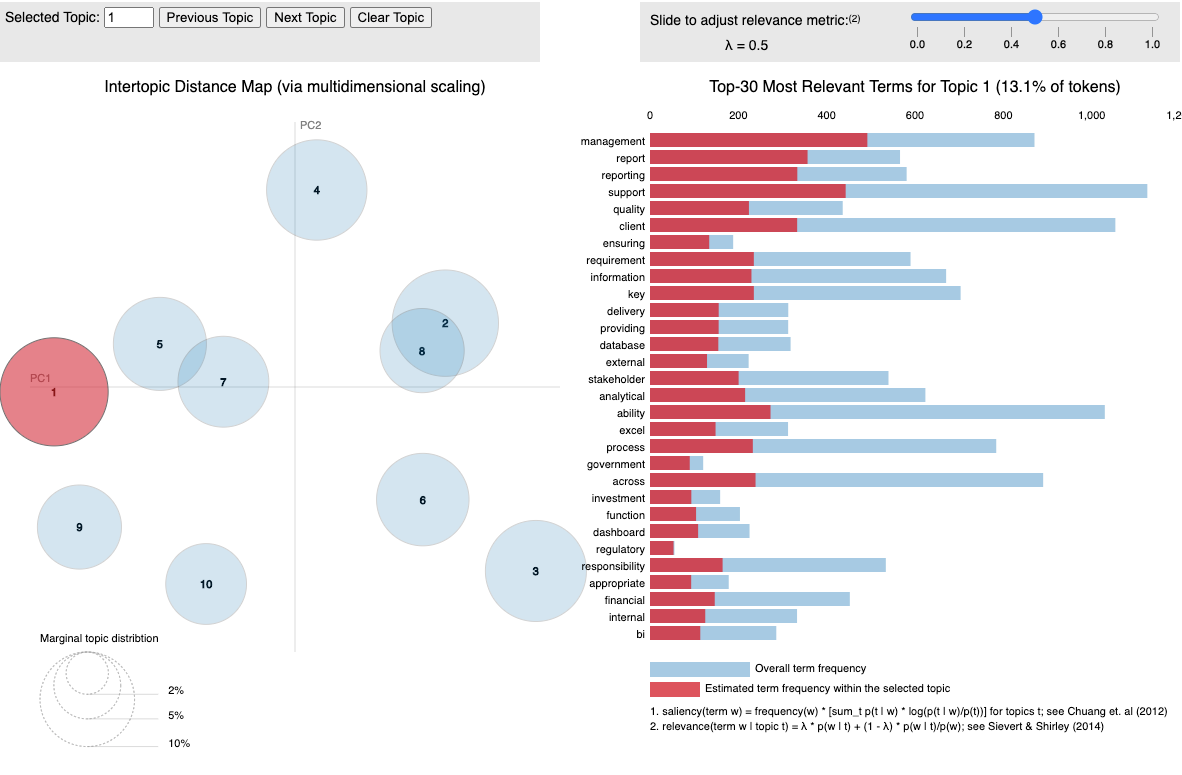
Using Latent Dirichlet Allocation and pyLDAviz (here’s my previous post on it), I determined a few emergent topics of interest. It’s important to note that, since this is an unsupervised approach, there’s a strong chance that the outputs are mostly noise, and not useful insights. However, guided by domain knowledge and other pieces of information in this dataset, we can infer at least 3 useful topics.
Client and Business-centric — (Fig 3.10) Roles heavily featuring this topic are focused more on delivering insights towards customers and using tools such as dashboards, excel, (power) ‘bi’ and thus providing analytical insights for the stakeholders.
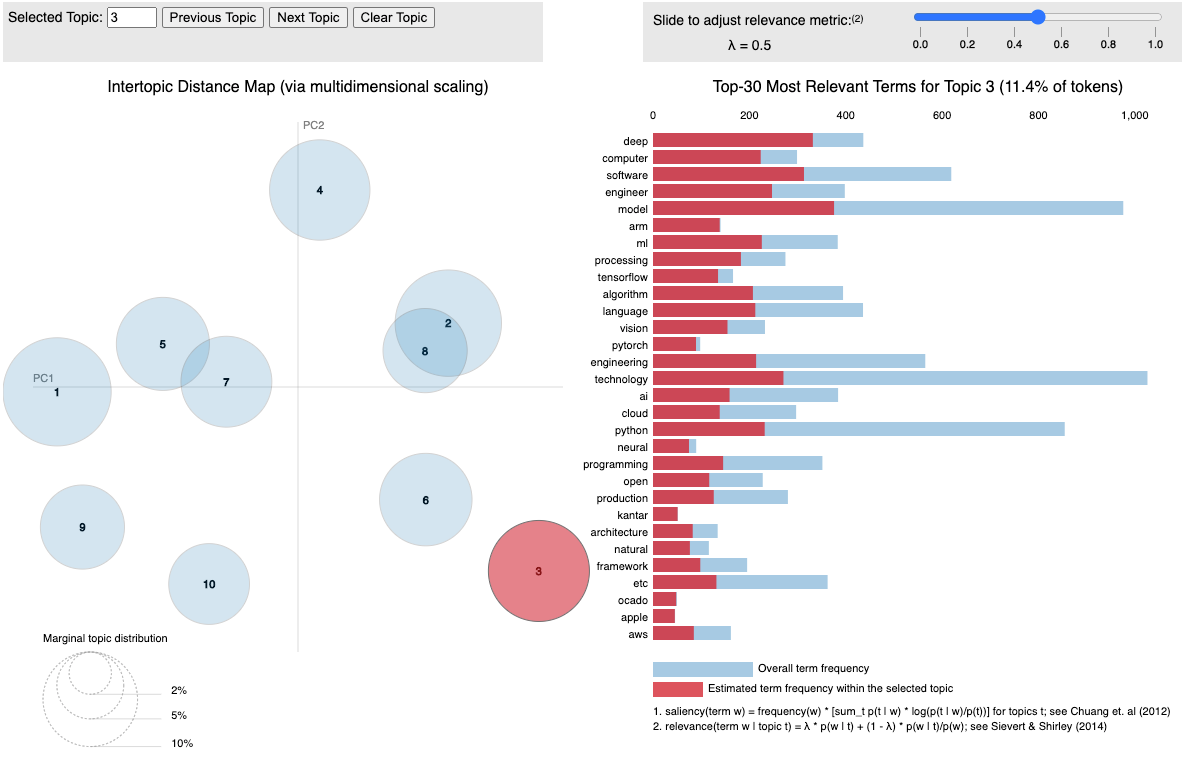
Development and Deep Learning— (Fig 3.11) This topic and associated job roles are focussed on development programming languages (‘java’), specific packages used for deep learning (‘tensorflow’, ‘pytorch’), niche areas (‘NLP’, ‘neural’ (networks)) and mentions ‘development’, ‘processing’ and ‘product’. This topic corresponds strongly to a lot of ML jobs.
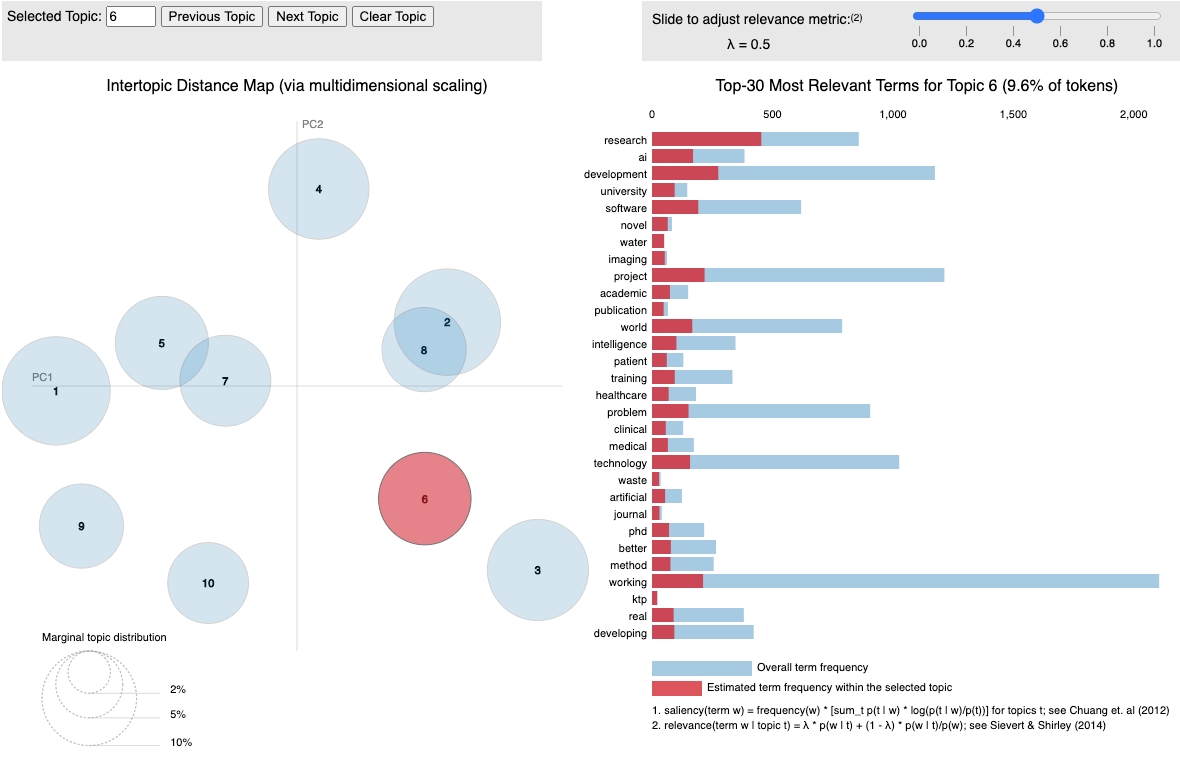
Academic & Scientific (Fig 3.12) — there’s a very strong association with this topic and terms such as ‘university’ and ‘research’ — more so than for any other topic! Also the only other topic with a strong association with ‘AI’, ‘novel’, ‘publication’ and ‘academic’ is Topic 1 — Deep Learning and Development.
5. Conclusion
My plan is to repeat this project in late Q1 2021 with a fresh batch of job post data and to improve the functionality of the web scraper to be able to detect tags for things such as “Remote working”. I hope that this exploratory analysis proves useful to some people, although I repeat that all findings should be considered in light of the unstructured and semi-rigorous nature of the work. None of these findings can/should be interpreted as conclusive, only preliminary. As said before, I appreciate any feedback and any claps! If I had to summarise the most important advice for aspiring data scientists in one bullet point it would be this:
Invest most time into mastering Python and SQL, play the long game and lower your initial expectations of what pay or job you’ll get, with the realistic hope that 2 years of building experience in your less-than-ideal job. Don’t spend too much time initially on niche, fancy areas like deep learning or NLP, you can revisit those at a latter stage. Knowledge of the basics, of how to solve problems and work experience are what pay off most.
Thank you.